What Is an Internet Speed Test and How Does It Work
An internet speed test measures download, upload, latency, and jitter between your device and a test server. Learn how it works and how to read results.
 Dig Trace Team· Network Engineering Team8 min read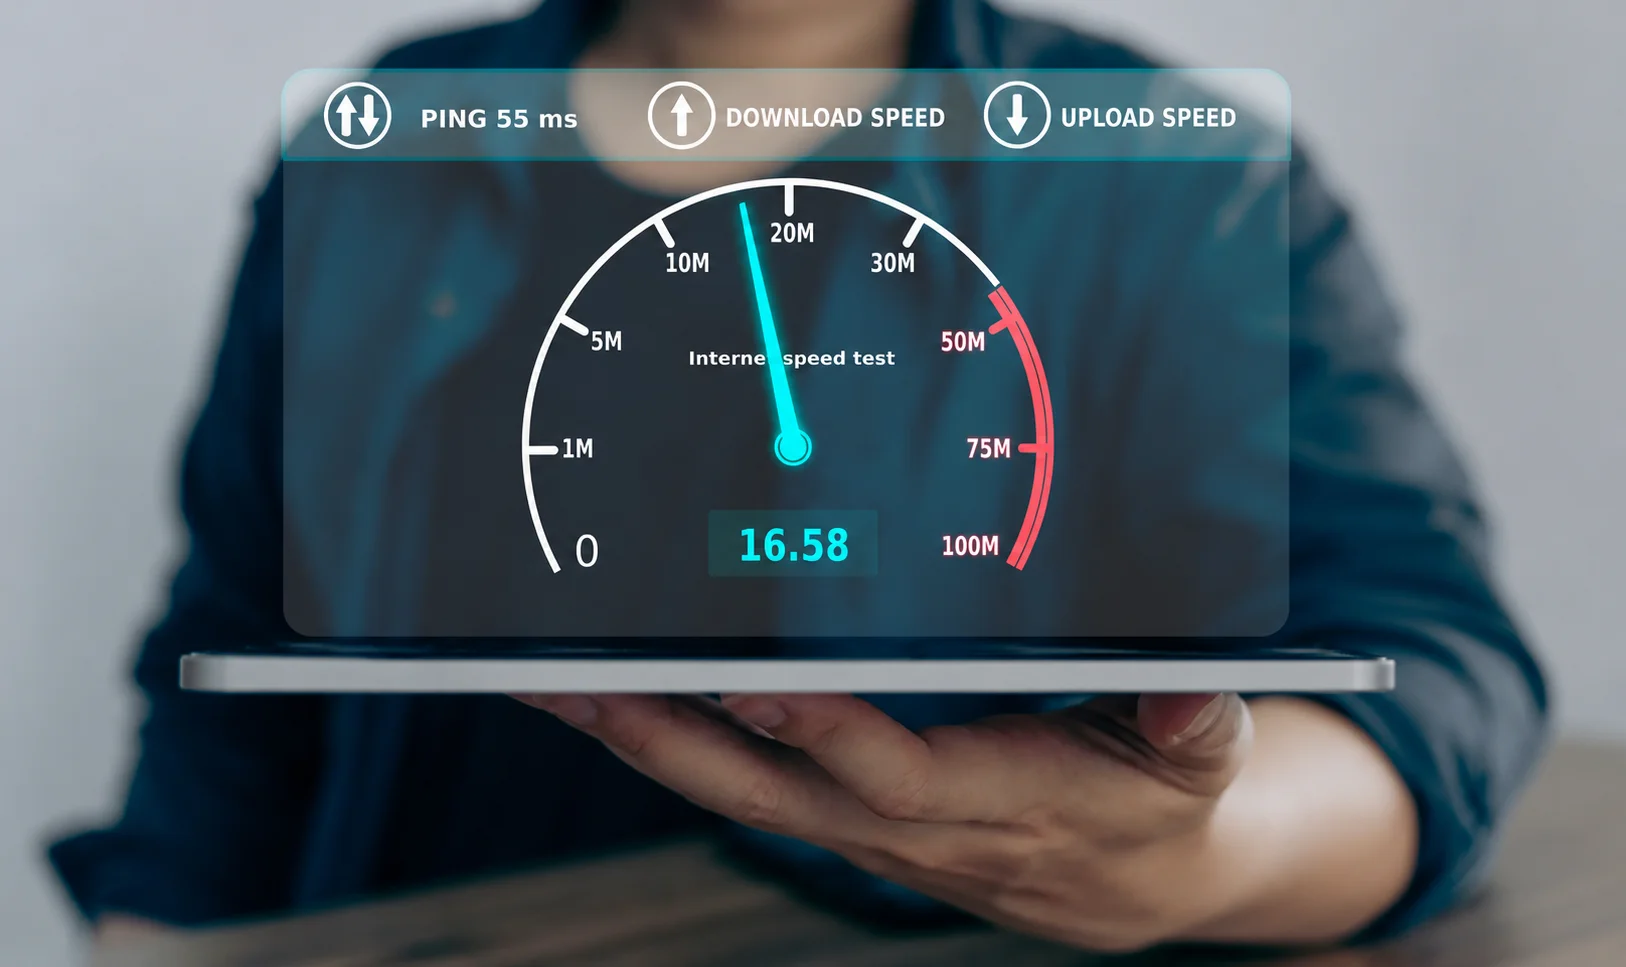
What is an internet speed test?
An internet speed test sends controlled traffic across the internet and times the exchange. The result is a set of numbers: download speed in megabits per second (Mbps), upload speed in Mbps, and latency in milliseconds (ms). Some tests also surface jitter, packet loss, and loaded latency.
Download speed measures how fast data travels from a server to your device. That governs how quickly web pages load, files download, or video buffers. Upload speed measures the reverse path. It matters when you send email attachments, back up files to the cloud, or join a video call. Latency, often called ping, is the round-trip time for a small packet to travel to the server and back. Low latency means a responsive connection. Jitter tracks how much latency varies from packet to packet, while packet loss indicates data that never arrived at all.
Your subscription plan promises a specific speed, but the test result depends on far more than your ISP's marketing. These metrics describe the path between your device and one specific test server at one specific moment. A test run at 9 AM may yield a very different result from one run at 9 PM because the test captures live network conditions rather than a static property of your plan.
How does an internet speed test work?
The process begins with server selection. The test client estimates your location, often by IP geolocation, and chooses a nearby server with low initial latency. Some tools let you pick manually. The client then sends a small signal, such as an ICMP echo or TCP handshake, to establish a baseline ping. That number becomes the latency figure.
To measure throughput, the client opens multiple parallel TCP connections to the server. It transfers chunks of data of increasing size, ramping up until the link is saturated. The tool records how much data moved during a stable interval and converts that into a rate in Mbps. Upload measurement follows the same logic in reverse, sending data from your device to the server. This multi-connection approach is designed to overcome TCP slow start and reveal the peak sustainable bandwidth available at that instant.
Modern tools go beyond simple peak measurements. Some track latency while the link is under heavy load, revealing bufferbloat. Others use WebRTC or varied payload sizes to expose performance quirks that a single large transfer might hide. Cloudflare's methodology which is used by Dig Trace distinguishes between unloaded and loaded latency to show whether a connection remains responsive when it's busy.
Variables outside your home matter just as much as your router. Because the test uses real traffic, the result reflects everything along the path. That includes your local Wi-Fi, your router, your ISP's access network, its peering relationships, the test server's network, and any congestion at the time. Changing any one of those variables can shift the outcome.
Official ISP speed tests vs third-party tools
Open your ISP's speed test page and you may see 500 Mbps. Run a third-party test at the same time and get 120 Mbps. Neither number is necessarily wrong. They are measuring different things.
ISP-hosted test servers are usually placed deep inside the provider's own network, sometimes on the same metro ring as your neighborhood node. The test traffic never leaves the ISP. That gives you a clean measurement of the access link. But it tells you nothing about what happens when your data hits a peering exchange or an upstream transit provider.
Third-party tools like Fast.com (Netflix's CDN paths), Ookla Speedtest (thousands of hosted servers, some inside ISPs, some not), or Cloudflare's test (routed through anycast edge nodes) often traverse more of the public internet. They expose congestion your ISP's own tool hides: an overloaded peering link, a saturated transatlantic cable, or a content delivery node serving stale routes. For a view from multiple network perspectives, tools like the Dig Trace online speed test route through diverse paths.
Neither approach is useless. The ISP tool verifies whether your local loop is healthy and delivering the contracted rate. The third-party tool shows what the rest of the world actually experiences when they talk to you. Use both. If the ISP tool shows 500 Mbps and the third-party tool shows 80 Mbps during peak hours, the problem is almost certainly the ISP's upstream peering capacity, not your router.
Common Causes of Differences in Speed Results
You run two speed tests back to back on the same connection and they disagree by 200 Mbps. This is not a bug. Several moving parts explain it.
Server location and routing. A test server in the same city might be 5 hops away. One in another country might be 15 hops, with a congested peering link in the middle. Even the same tool can give different results if its auto-picker selects different servers across runs.
TCP connection strategy. Many popular tools open many parallel TCP flows to maximize aggregate throughput. That approach pushes a gigabit connection to its ceiling. Other tools use fewer connections or simulate a single-threaded download. That looks slower on paper but more closely mimics how a typical web page or application behaves. Both ways are valid. You just need to know which one you are looking at.
Test duration and sampling method. A 3-second test and a 15-second test produce different results because TCP congestion control takes time to find the right window size. Tools also differ in how they compute the final number. Some average the entire run, including the ramp-up phase. Others discard the first and last samples and report only the stable middle interval. Some strip outliers, some do not. Comparing two tools without comparing their methodology is comparing numbers produced by different formulas.
Local environment. A laptop on 2.4 GHz Wi-Fi two rooms from the router will rarely match a desktop on Ethernet. Background apps like cloud sync, Steam updates, or streaming steal bandwidth silently. A CPU-bound machine can bottleneck a gigabit test because the network stack itself hits the ceiling before the connection does. Browser choice also matters. Chrome and Firefox handle WebSocket connections differently, which can shift throughput numbers by 10 to 15 percent.
Time of day. ISPs share capacity across neighborhoods. At 2 AM you might see 490 Mbps on a 500 Mbps plan. At 8 PM, with everyone streaming, that same connection might show 200 Mbps. Neither number is a lie. Only one of them is relevant if you work from home in the evening.
Limitations and Extensions of Network Speed Testing
A speed test measures link capacity, not application experience. A 1 Gbps line with severe bufferbloat will deliver a great throughput number and simultaneously wreck every Zoom call you join. The number is accurate. It just does not answer the question you actually care about.
Networks change by the minute. A single test captures one moment. Your Wi-Fi may be clear now and crowded ten minutes later. Your ISP's upstream link may be idle now and saturated during evening streaming hours. A single test cannot prove that your connection is always fast or always slow.
Continuous monitoring catches what one-off testing misses. Tools that run periodic latency checks and log results over days or weeks spot intermittent degradation that a manual test will never find. If your connection drops packets every 45 minutes, a single speed test will never see it. A 24-hour monitor will find it by morning.
To diagnose where a slowdown originates, combine speed tests with path-tracing tools. Traceroute shows each router hop between you and the destination. DNS resolution checks reveal whether slow page loads are caused by lookup delays rather than bandwidth limits. Understanding your connection means looking past the headline Mbps number to the full chain of links, protocols, and devices that carry your traffic. You can explore traceroute and DNS lookup tools for this, or start measuring at the Dig Trace speed test page.
Check your IPv6 path too. Most ISPs now run dual-stack, and IPv4 and IPv6 traffic often follow different routes with different latency profiles. If your speed test runs over IPv4 but your streaming service prefers IPv6, the result will not reflect what you actually experience. Test both.
Internet speed tests are useful once you understand their limits. Run them on Ethernet, compare ISP and third-party servers, look at loaded latency not just throughput, and test at the times you actually use the internet. With that discipline, they become evidence for a conversation with your ISP, not just numbers on a screen.
For details and guidance on how to run an accurate speed test, see how to run an accurate internet speed test.